Choosing the right visual is critical to properly explain the meaning of the data to the end user. This blog provides guidelines for most common visualization types.
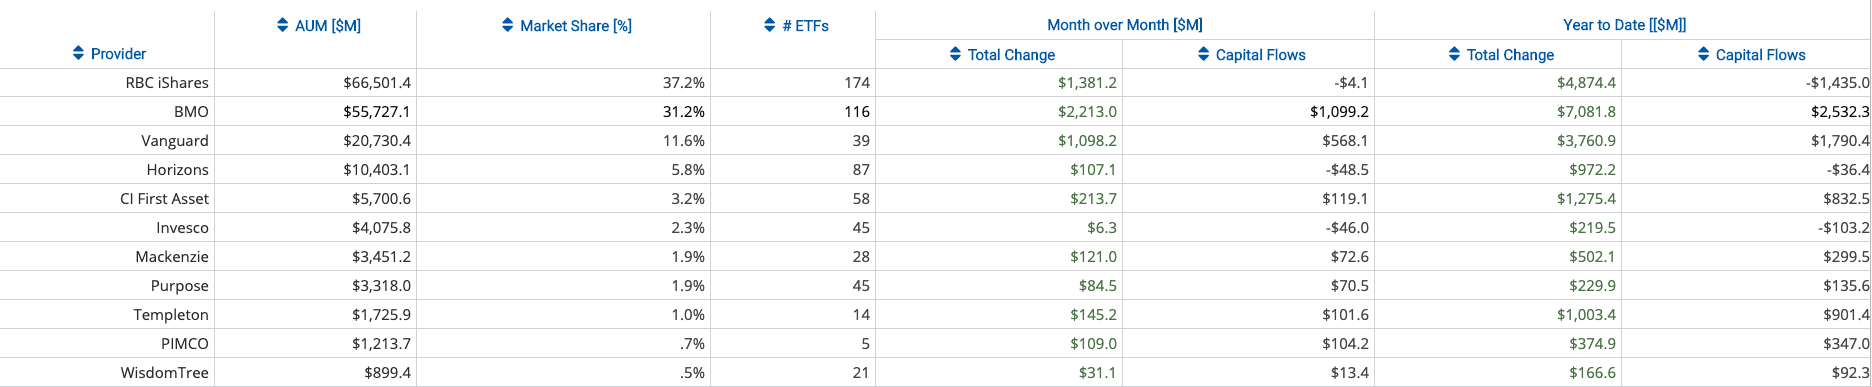
Tables list records and consists of rows and columns. Tables can show a lot of information in a structured way. You should always structure the layout with the target end user in mind – in case he is looking for high-level trends, do not overwhelm him with too many details.
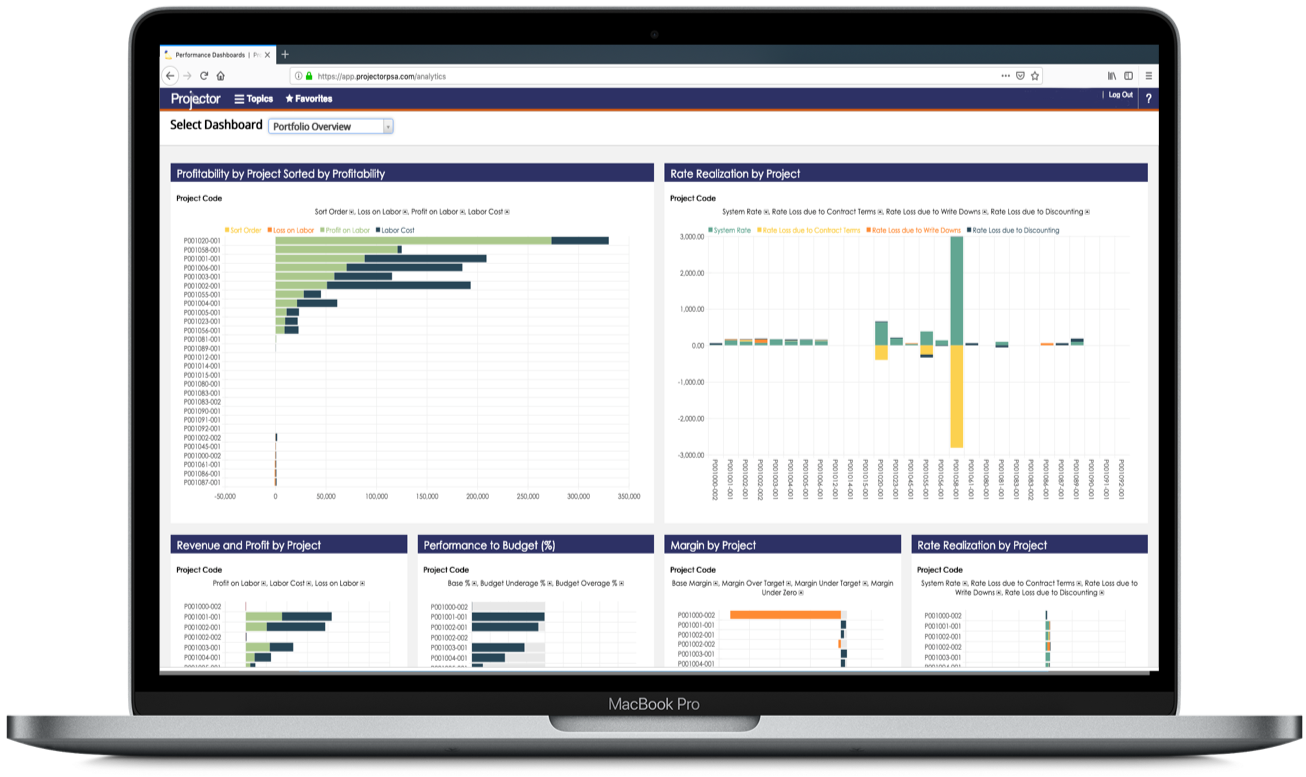
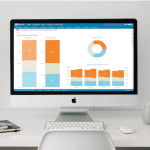
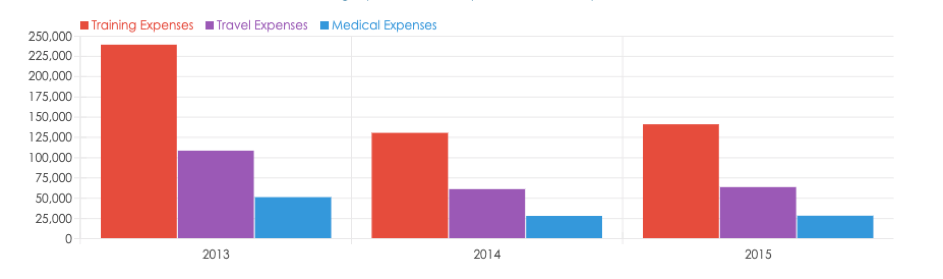
Bar charts are used to compare quantities of different categories or KPIs. Apply ordering to help the user find the relationship between the values. In case your bar chart contains more KPIs, apply a different color to each of them.
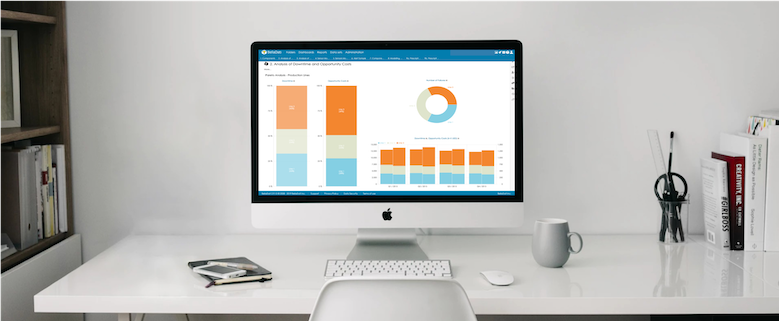
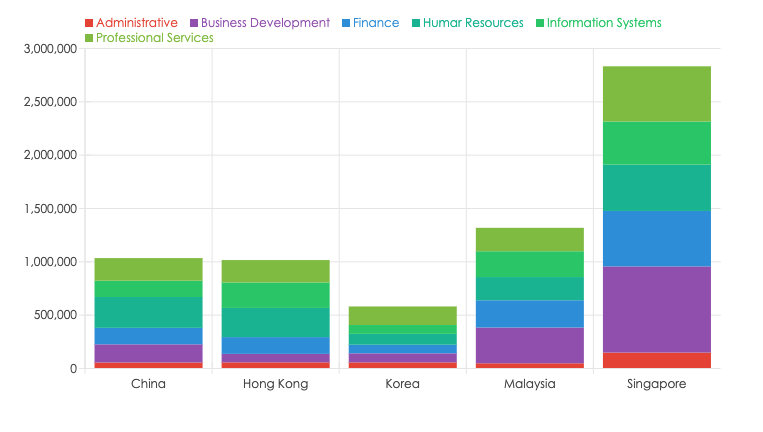
Stacked bar charts use bars to show comparisons between categories of data, but with the ability to break down and compare parts of a whole. Each bar in the chart represents a whole, and segments in the bar represent different parts or categories of that whole.
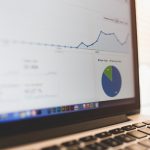
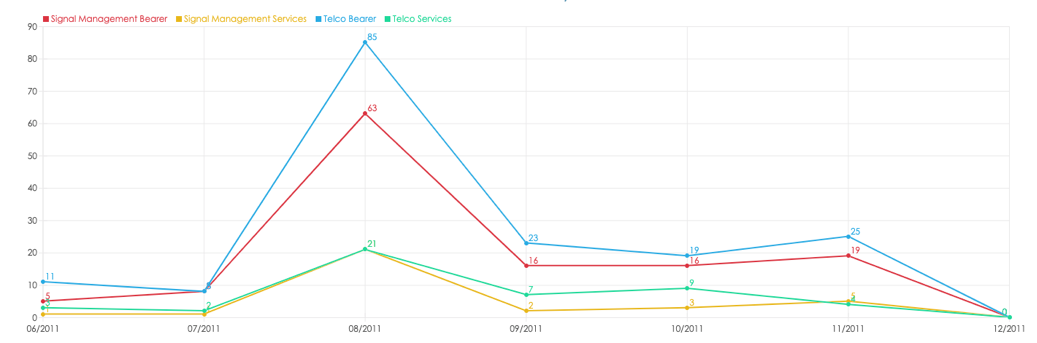
Line charts track trends in time and show relations between KPIs or variables.
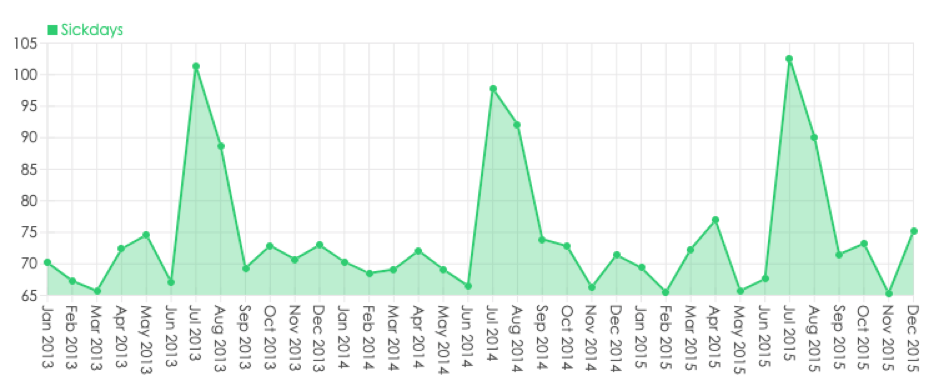
Area charts are similar to line charts but display background below the line.
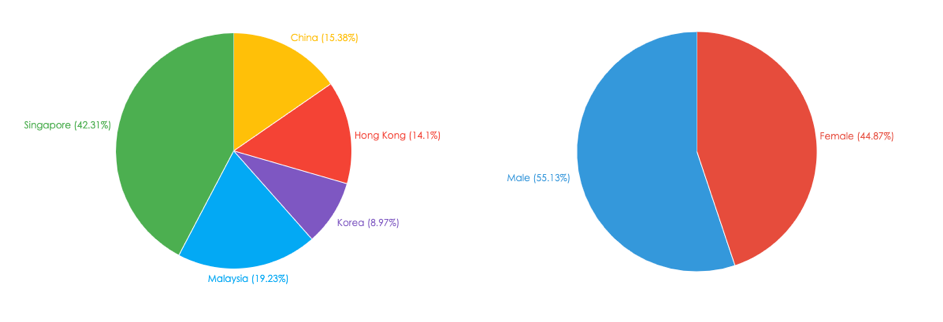
Pie charts are used to compare parts of a whole. Always consider displaying the values next to the labels so that the user can immediately see the difference between displayed values.
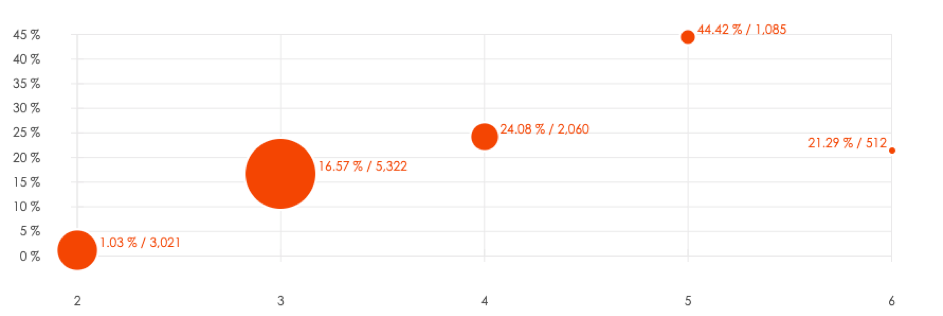
Scatter plots presents values from different measures over one dimension as a collection of points.
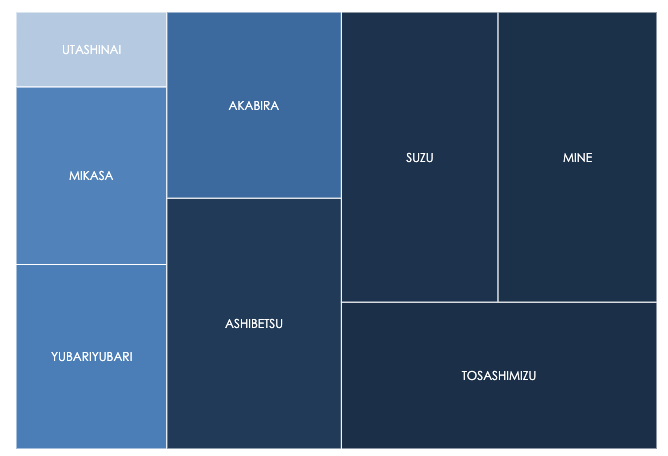
Treemaps are great for comparing the proportions between categories via their area size. If you compare 2 KPIs, the proportion of the second KPI will affect the shade of the rectangle – the highest proportion equals to the darkest shade.
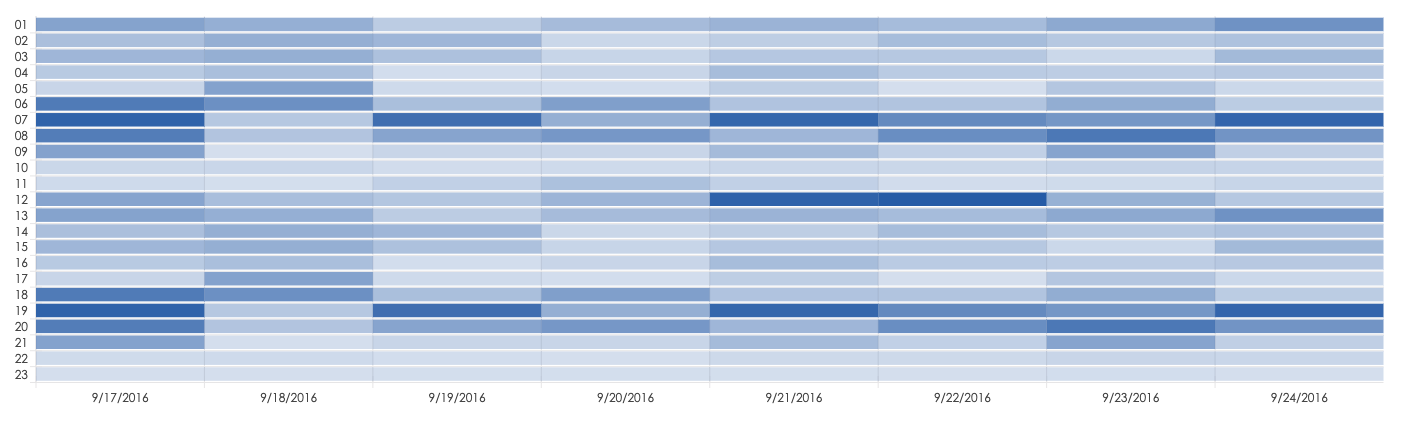
Heat maps will help you to find hidden trends in your data. Values are displayed in a matrix and are represented as color.
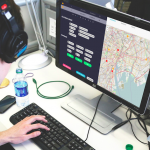
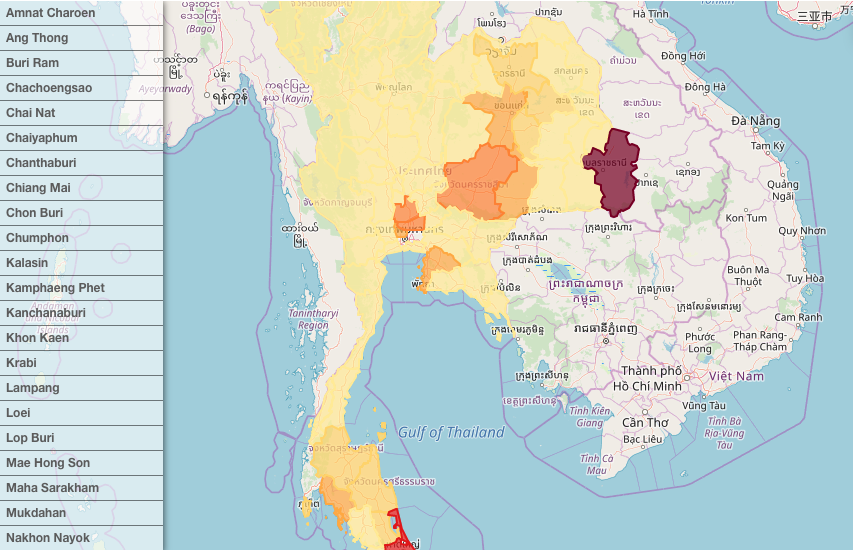
Geo maps allow you to visualize data that contains geographical values. Maps can be displayed in a form of points or shapes.
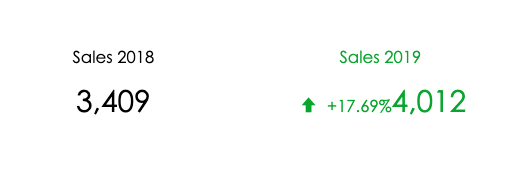
KPI Labels are used to highlight any key metric in a report or dashboard for easy comprehension. The key metric can also be accompanied with associated comparison indicators to highlight the trend.